SEMfont
This file offers a rudimentary
TrueType font containing two symbols: stochastic
dependence (in place of !) and stochastic independence (in place
of @).
Implementing Some
Basic Simulation Designs Using the simsem Package in R
(version 3)
This
pdf document provides a tutorial for multiple-condition
simulations. Four R scripts
accompany the tutorial.
Understanding Equations in Basic Statistics (version
2)
This pdf document provides a
tutorial on understanding equations for students new to
statistics.
R in and Hour
Use this link to download the most current version of the
R script from my "R in and Hour" presentation. As the
name suggests, this is a 1-hour basic introduction to using R
for statistical data analysis. Version 6, 28 August
2024: Added information about R Studio.
Version 5, updated 18 October 2021: Added, among other
things, an expanded section on resources and advice for those
new to R.
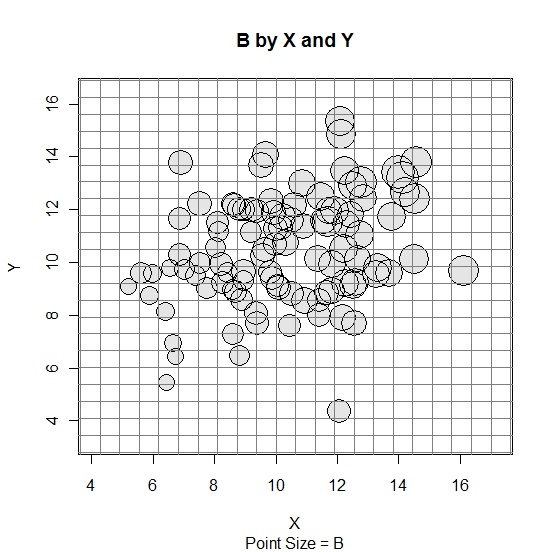
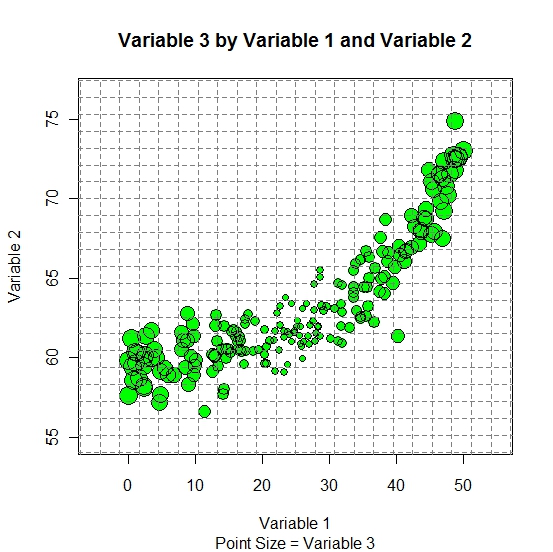
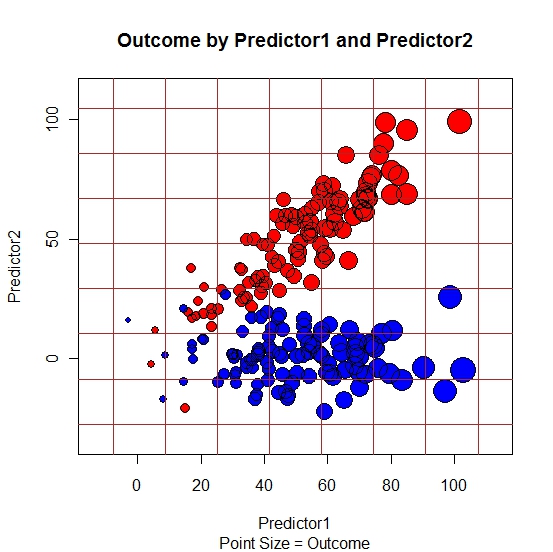
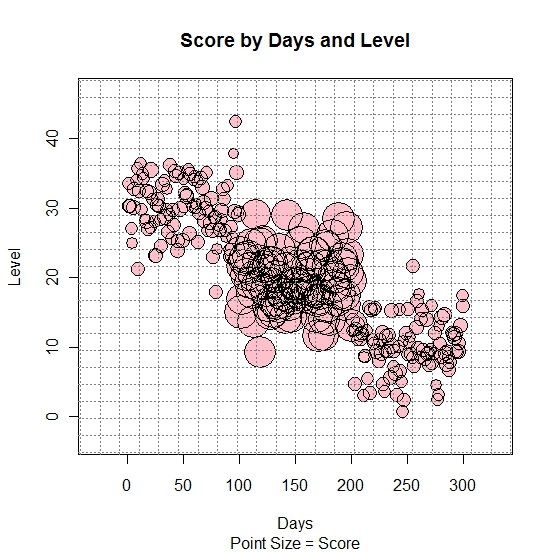
Bubble plot 3-way
The bp3way function is an R function for drawing
scatterplots of 3 continuous variables in which the third
variable is indicated by the size of the dot. If you do not have
R installed, get it from the Comprehensive R Archive
Network. If you have R installed, you can simply download
the files below. From the R console, open the file as an R
script and run the entire file. Once you run the file, the
associated function is available for use. If you save the
workspace, the function will load with the workspace. Note that
both files are text files and will open in a word processor or
any other software for viewing text files in addition to R. For
a detailed description of the bp3way function, see Markus &
Gu (2010).
bp3way (version 3.2):
This function facilitates easy plotting of 3-way bubble plots.
The end of this script file contains help for the bp3way
function.
bp.data (version 5.1):
This is a simple function for simulating data to test bp3way.
This function is not needed to use bp3way but is offered as a
convenience.
Markus, K. A., Gu, W. (2010). Bubble plots as a
model free graphical tool for continuous variables. In H. D.
Vinod (Ed.), Advances in social science research using R (p.
65-94). New York: Springer.
Created 26 January 2011.
Migrated 17 August 2011.
Updated 26 January 2012.
Updated 25 October 2013.
Updated 14 July 2016.
Updated 15 July 2016
Updated 17 July 2016
Updated 21 August 2016
Updated 16 September 2016
Updated 23 May 2020
Updated 20 March 2021
Updated 8 October 2021