Keith Markus' Urban
Sprawl
Syllabus
PSY 769: Intermediate
Statistics in the Social Sciences
Spring 2016
Professor Keith A. Markus
Time:
Section 02: Tuesdays
6:15-8:15 PM
Room:
Section 02: 3.81 NB
Course Description
"The primary purpose of the course is to
educate students about basic [statistical] theories and
techniques used in the behavioral sciences. The instructor
will briefly review information typically covered in
undergraduate statistics, and then introduce more advanced
statistical techniques. Upon completion, the student is
expected to understand the theoretical underpinnings for the
various statistical techniques and the assumptions that data
must meet to validly use these statistics. The student will
also gain an introduction to computer-based statistical
analysis. 30 hours. 3 credits." (from
Graduate Bulletin)
Many students enter the course several years
after having taken an undergraduate statistics course.
Moreover, new material often precedes review material in order
of logical development. As a consequence, we will
"briefly review" introductory material as if it were new
material and do so for most of the semester.
Nonetheless, from the start, we will cover most of the
material in more depth than a typical undergraduate course.
Computer based statistical analysis will
largely be limited to the use of spreadsheets. This is
because we offer another course entirely devoted to the topic
of computer based statistical analysis (PSY 737). I
highly recommend that course to both thesis and non-thesis
students.
Course
Objectives
1. Students will learn to view psychological phenomena from
the perspective of quantitative stochastic processes.
2. Students will develop linguistic competence in
interpreting, describing, and critically evaluating basic
statistical data.
3. Students will gain experience reasoning from and about
numerical data.
Note: It is not possible for this
course to cover all of the statistics that you might need for
a thesis. If you plan on doing a thesis, prepare
yourself for the fact that your data analysis will likely
involve at least some statistics not covered in this
course. See Blackboard for a document comparing what it
covered in this course to other benchmarks.
Required Reading
Bachman, R & Paternoster, R. (2008).
Statistical methods for criminology and criminal justice (3rd
ed.). New York: McGraw Hill. The
book is out-of-print but still available. The College
bookstore offers a print-on-demand version as well as used
copies. (Caution: If you rent, make sure that the
rental term reaches through finals week.)
Additional materials will be posted on Blackboard. Please
see Blackboard for a list of textbook errata.
Software
The course requires
the use of either Excel (available as part of
Microsoft Office in college computer labs) or Calc (freely available as part of
Apache OpenOffice at the following URL: http://www.openoffice.org/).
The programs are very similar, but there are some important differences.
Such spreadsheet software remains a popular
choice for data entry even
among researchers who use more specialized statistical
software for data analysis (the topic of PSY 737). However,
research shows that specialized statistical software can be more confusing
than enlightening
when learning fundamental statistical
concepts. Excel/Calc offer a simple computing
environment for working with data
ideal for learning and gaining confidence
with fundamental
statistical concepts.
(Mac users: You can
open both Excel and Calc
files using the Mac version
of OpenOffice.)
Class Time
Do the reading before the corresponding class. If you
have questions about the reading, bring them to class and I will
try to answer them there. I want to leave some flexibility
to use the class time in the manner you will find most useful.
Homework
The homework assignment is the same for each assigned
chapter: (a) Provide a definition for each of the "Key
Terms" listed at the end of the chapter and (b) provide a brief
explanation of each of the "Key Formulas" listed at the end of
the chapter (note that most of these are in fact equations
rather than formulas). A good explanation paraphrases the
equation (or formula) in words, it tells the reader what the
formula says. Simply stating what the equation is used for
does not offer a good explanation of the equation itself.
It is not necessary to reproduce the formulas or
equations. Note that you do not fully understand an
equation unless you recognize each of the individual terms
(e.g., n, s, x) used in the equation. Clearly mark the "Key
Terms" and "Key Formulas" sections of your homework. Note
that Homework 2 and 3 contain two chapters each.
Use the following format for your homework
assignments.
At the top of the page: full name, Homework Number, Chapter(s)
(these are listed on the syllabus schedule).
Key Terms Heading: list and define key terms as listed in back
of chapter.
Formulas Heading: list and describe formulas as listed in back
of chapter.
Optional Challenge: If you would like an
additional challenge to help promote understanding of the
formulas (and equations), construct a set of input values that
will result in an answer of zero for each formula (provided that
zero is a valid value, otherwise choose a valid value).
For example, give a set of values that would result in a rate of
zero (Chapter 2) or a mean of zero (Chapter 4). This is
not required.
Homework assignments are due at the start of
class for the day on which the reading was assigned. See
the course schedule at the end of the syllabus for
details. I recommend completing the homework as you read
the chapter rather than reading first and saving the homework
until afterward.
Your homework serves as your review guide for the
examinations. Although I will make every effort to return
homework in time for the exam, this will sometimes require you
to pick up your homework from an envelope outside my
office. So, consider completing your homework
electronically or making a photocopy before turning in homework
the class immediately preceding an examination.
Examinations
The examinations will not require calculations or
software, but may include examples of spreadsheet formulas or
results of spreadsheet calculations. The examinations will be
multiple choice. Before the first examination, I will post a
preparation guide to Blackboard. Keep your homework for
use as a review guide.
At the final examination, you will have the
option of taking alternate versions of Test A and Test B to
possibly improve your grade on the earlier tests.
Before each exam, I will maintain a Q&A sheet on Blackboard
containing my answers to student questions received by
email. The sooner you email your questions while studying
for an exam, the sooner I can post answers and the more
opportunity others have to learn from them.
Grading
Your final grade comprises your three examination
grades (75%, 25% each) and your homework assignment grade (25%,
about 2% each). I
will return all grades in percent form, so to compute your
final grade you multiply by the above percentages and add them
up: Final Grade = .25(Exam A) + .25(Exam B)
+ .25(Exam C) + .25(Homework Total). I
will assign letter grades as indicated below. Note that I will
do the above computation before rounding, so your results may
differ by rounding error in the reporting of individual
grades.
 Grading on a curve
normally refers to forcing grades onto a normal distribution to
fix the proportion of students receiving each letter
grade. I do not grade on a curve because it makes it
impossible for everyone to do well. Anyone who meets the
criteria can earn an "A" in this course (or any other grade) no
matter how other students do. In other words, grading on a
curve means that your grade depends upon how well other students
do in the course. In this course, your grade only depends
on how well you do. (So, I encourage working together to
learn the material.)
Grading on a curve
normally refers to forcing grades onto a normal distribution to
fix the proportion of students receiving each letter
grade. I do not grade on a curve because it makes it
impossible for everyone to do well. Anyone who meets the
criteria can earn an "A" in this course (or any other grade) no
matter how other students do. In other words, grading on a
curve means that your grade depends upon how well other students
do in the course. In this course, your grade only depends
on how well you do. (So, I encourage working together to
learn the material.)
However, I will determine your grades using a
different kind of curve. The reason for this is that
multiple choice tests tend to be very effective assessment tools
in the sense that that they distinguish effectively between
different student's levels of understanding. That is, they
are very effective a spreading people out. However, a
variety of policies in the MA program were designed on the
assumption that MA course grades would have a compressed
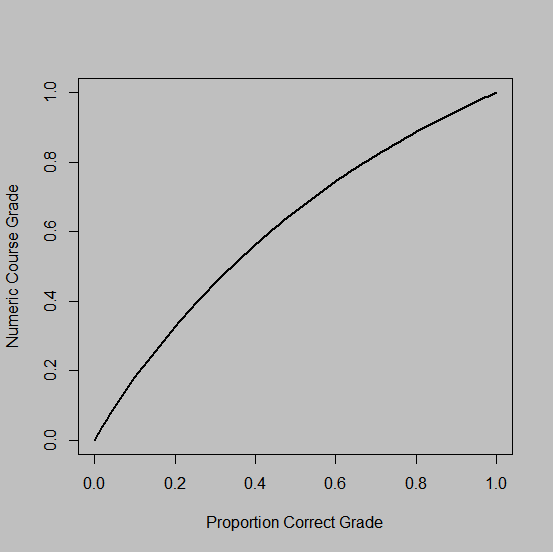
distribution. To accommodate this assumption, I will
translate your proportion correct into a numeric course grade
using a nonlinear transformation. This transformation is
based on the an arc connecting the point <0,0> to the
point <1,1> along the edge of a circle with a center at
<2,-1> (as shown in the graph). Numeric Course Grade
(NCG) can be computed from your proportion correct grade (PCG)
using the following equation: NCG = (-1 + sqrt(5 - ((PCG -
2)^2))). This amounts to a diminishing returns curve such
that each time Proportion Correct increases, Numeric Course
Grade increases by a little less. As Proportion Correct
increases, the proportion of students with at least that
Proportion Correct decreases, so the result is the desired
compression of the grade distribution (squeezing students closer
together).
I will use the following chart to
convert Numeric Course Grades to Letter Course Grades. I
will round x.5 and above up and anything below x.5 down.
I will use the above equation to convert Percent Correct into
Numeric Course Grades. So, the below chart offers only a
rough guide for that.
| Letter Grade |
Numeric Course Grade |
Approximate Percent Correct Grade
|
| A |
.95-1.00 |
.91-1.00
|
| A- |
.90-.94 |
.82-.89
|
| B+ |
.85-.89 |
.74-.81
|
| B |
.80-.84 |
.67-.73
|
| B- |
.75-.79 |
.61-.66
|
| C+ |
.70-.74 |
.55-.60
|
| C |
.65-.69 |
.49-.54
|
| C- |
.60-.64 |
.44-.48
|
| F |
.00-.59 |
.00-.43
|
You can use the below grade calculator to estimate your course
grade. This requires a web browser that supports JavaScript.
Contact Information: (It usually works best to
email me.)
Office
Hours: Tuesdays 4:00 PM to 5:00 PM and by
appointment.
Office: Room 10.63.11, 524 W59 Street.
Phone:
212-237-8784 (I do not check voice mail when off campus.)
Email: KMarkus@aol.com
Schedule
Week
|
Section 01 Tuesday
|
Assignments
|
Topics |
1
|
2/2
|
Ch 1 (Recommended, Appendix A)
No homework (HW) due.
|
Why am I here? What is this class about?
Syllabus.
Statistical inference and Sampling.
|
2
|
2/16
(2/9 Friday schedule)
|
Ch2-3
HW1: Ch 1.
HW2: Ch 2-3.
|
Levels of measurement, Distributions |
3
|
2/23
|
Ch 4-5
HW3: Ch 4-5
|
Central tendency, Dispersion |
4
|
3/1 |
Test A (Chapters 1-5) |
|
5
|
3/8 |
Ch 6
HW4: Ch 6 |
Probability, Hypothesis Testing |
6
|
3/15 |
Ch 7
HW5: Ch 7 |
Point estimation, Confidence Intervals |
7
|
3/22 |
Ch 8
HW6: Ch 8
|
Single group mean and proportion |
8
|
3/29 |
Ch 9
HW7: Ch 9
|
Hypotheses and Categorical data |
9
|
4/5 |
Ch 10
HW8: Ch 10
|
Two group mean and
proportion |
10
|
4/12 |
Test B (Chapters 6-10)
|
|
11
|
4/19 |
Ch 11
HW9: Ch 11 |
ANOVA |
12
|
5/3
(4/26 No classes)
|
Ch 12
HW10: Ch 12
|
Bivariate correlation and
regression. |
13
|
5/10 |
Ch 13
HW11: Ch 13
|
Multiple regression |
14
|
5/17
|
Ch 14 (http://statpages.org/logistic.html)
HW12: Ch 14
|
Logistic regression
|
15 (Finals week)
|
5/24
|
Test C (Chapters 11-14)
|
|
Source: http://www.cuny.edu/academics/calendars.html
Created 13 March 2013
Updated 27 January 2016
Created and tested using SeaMonkey
2.26.1. Best viewed using a Mozilla web browser.